GPU Profiler Quick Start
Within minutes of following this guide, zymtrace will profile your GPU workload and surface exactly what is slowing it down.
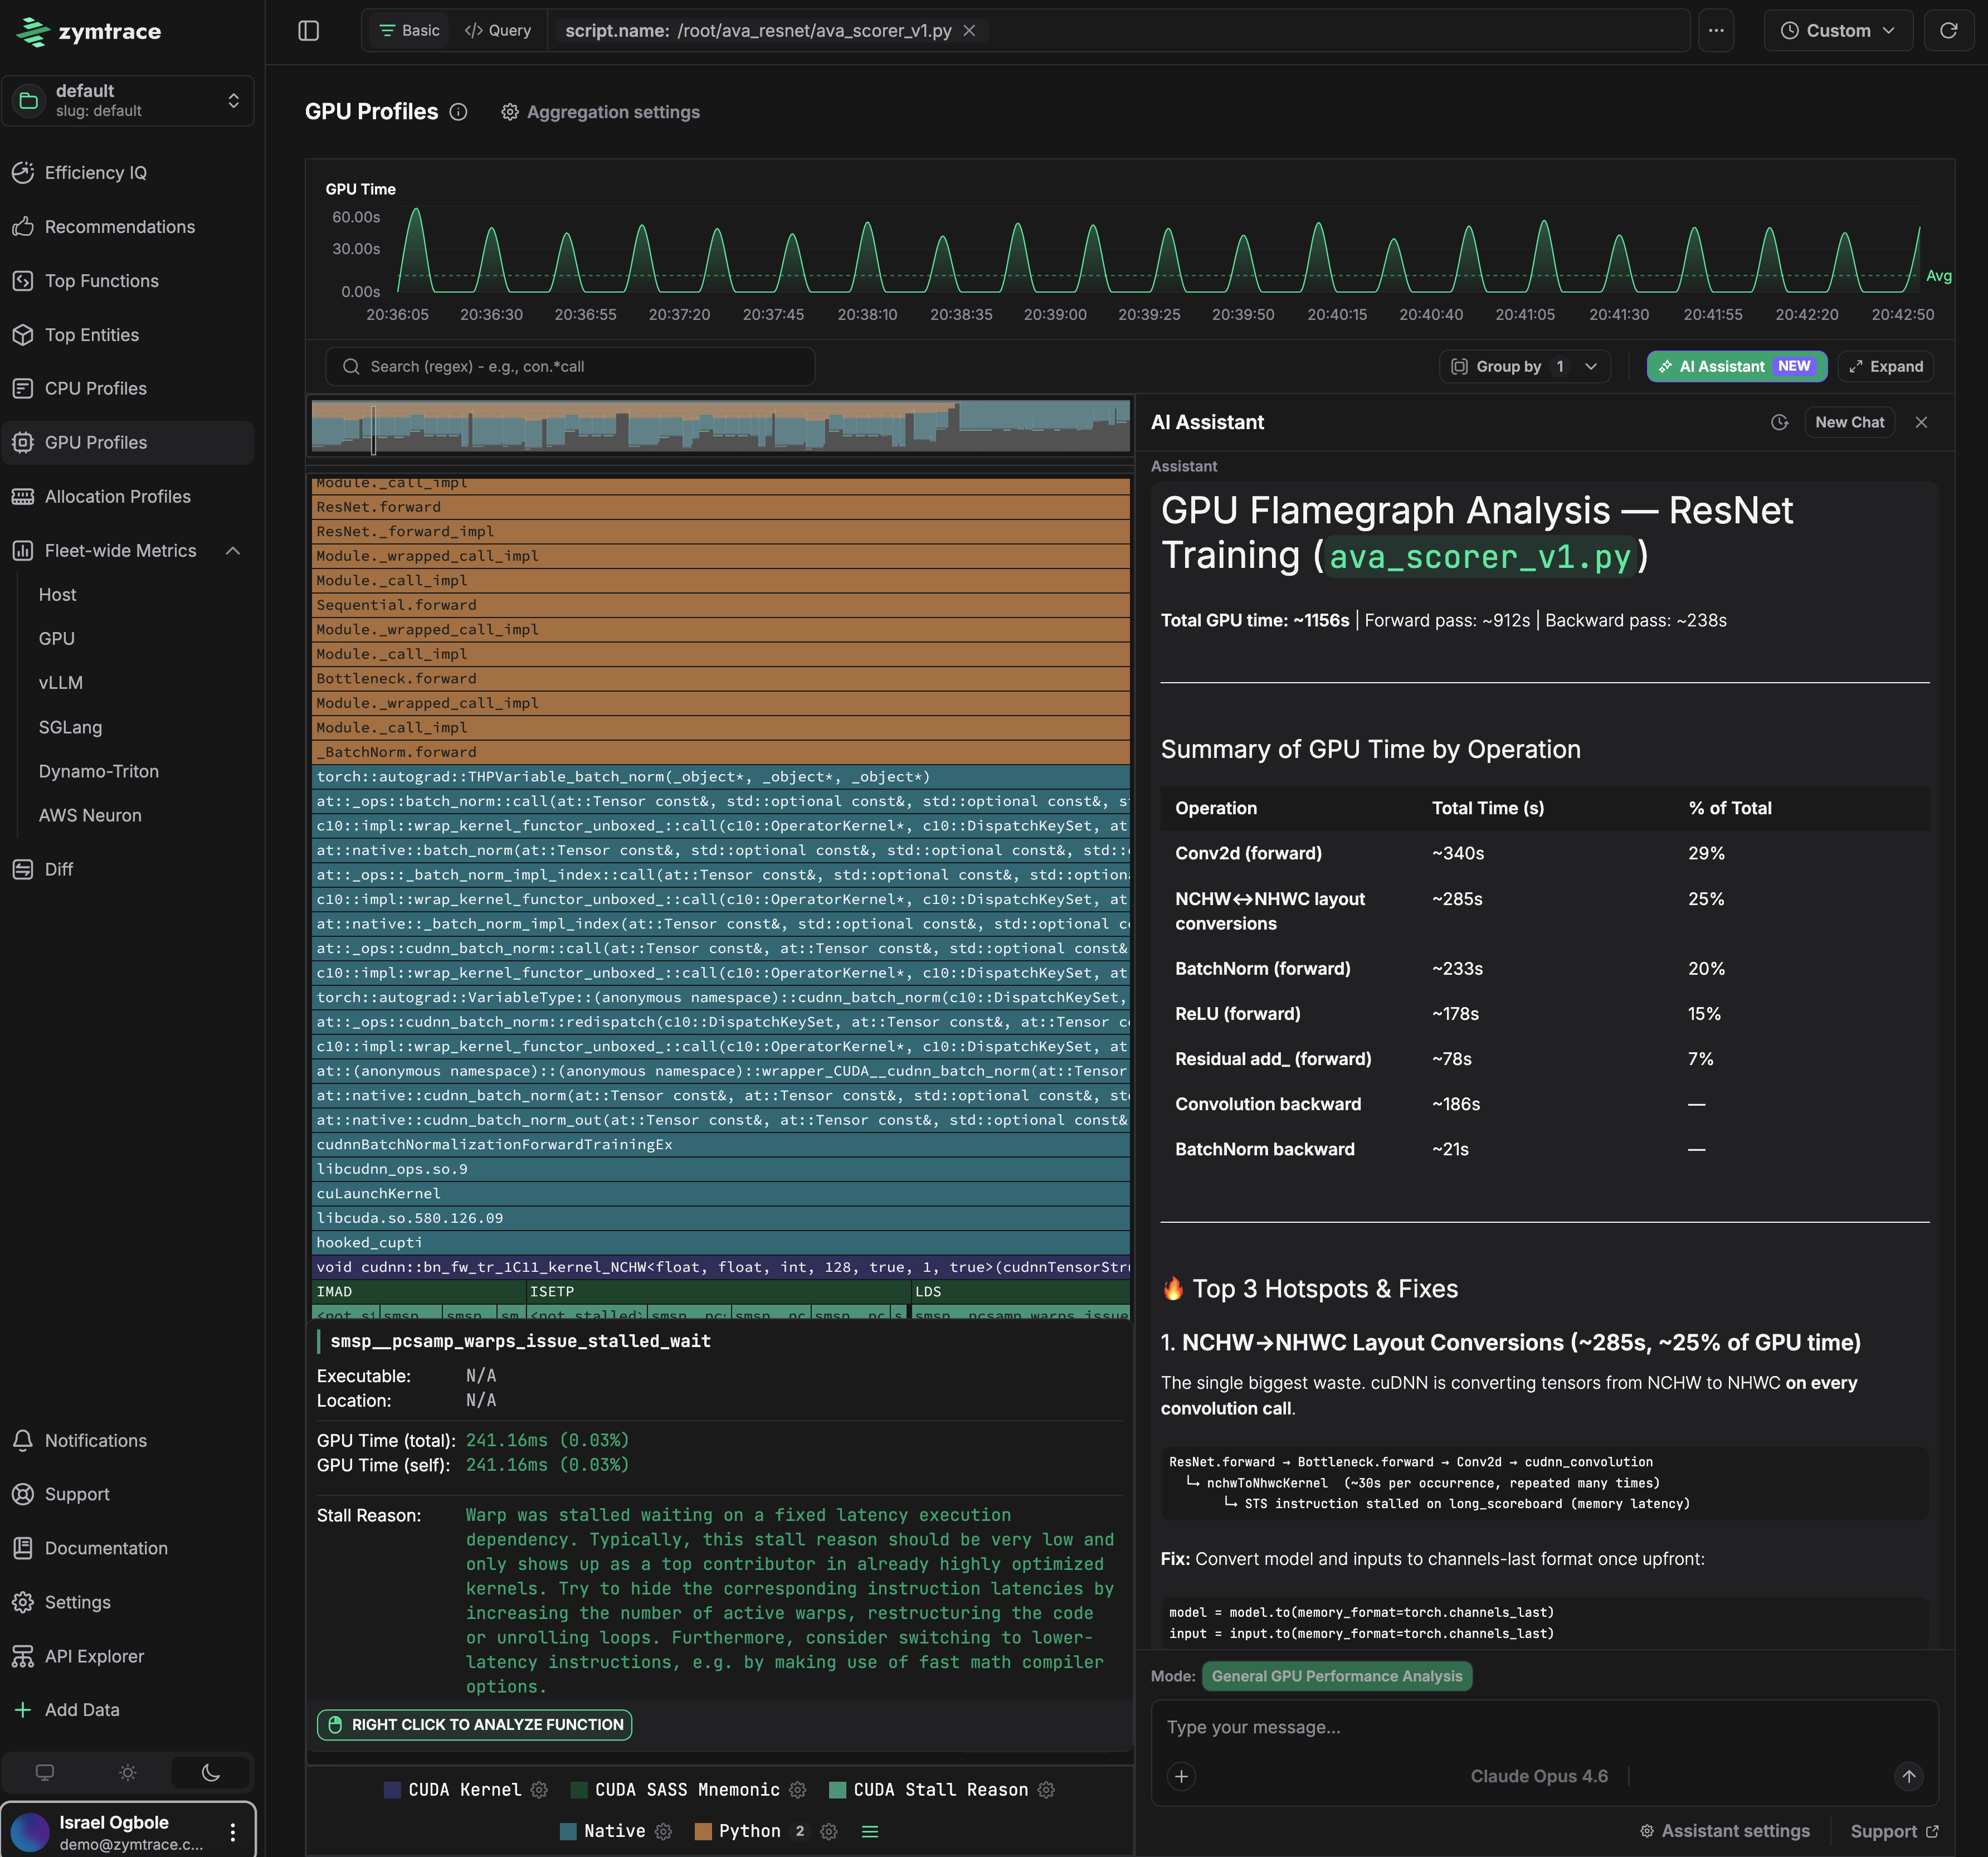
The flamegraph below is from a ResNet training run. No code changes were made. zymtrace found that 25% of total GPU time (285s out of 1154s) was being wasted on NCHW to NHWC layout conversions — cuDNN silently converting tensor memory layouts on every convolution call. The fix is a single line: convert the model and inputs to channels-last format once upfront.
That level of insight — tied directly to the code path responsible — is what this guide gets you to.
This guide walks you through getting the zymtrace GPU profiler up and running quickly. Choose the deployment method that matches your environment.
This guide assumes you already have the zymtrace backend installed. If not, set that up first.
Prerequisites
- Linux x86_64 or arm64
- NVIDIA GPU with CUDA 12.x support
Installation
Replace ZYMTRACE_URL with your zymtrace backend address (e.g. zymtrace.company-domain.com:443).
- Binary
- Kubernetes (Helm)
- Docker
Binary/Executable
The simplest way to get started on a single machine.
1. Download and extract
# For x86_64
curl -LO https://dl.zystem.io/zymtrace/26.4.4/amd64/zymtrace-profiler.tar.gz

# For arm64
# curl -LO https://dl.zystem.io/zymtrace/26.4.4/arm64/zymtrace-profiler.tar.gz

sudo tar -xzvf zymtrace-profiler.tar.gz -C / --no-same-owner
2. Start the profiler
sudo /opt/zymtrace/profiler/zymtrace-profiler \
  --collection-agent ZYMTRACE_URL \
  --enable-gpu-metrics \
  --nvml-auto-scan
If TLS is not enabled (e.g. NodePort or local setup), add --disable-tls:
sudo /opt/zymtrace/profiler/zymtrace-profiler \
  --disable-tls \
  --collection-agent ZYMTRACE_URL \
  --enable-gpu-metrics \
  --nvml-auto-scan
3. Run your application
Basic GPU profiling (no privileged access required):
env CUDA_INJECTION64_PATH="/opt/zymtrace/profiler/libzymtracecudaprofiler.so" \
    python -u your_script.py
With PC sampling (requires sudo, see PC Sampling):
sudo env RUST_LOG="zymtracecudaprofiler=info" \
    CUDA_INJECTION64_PATH="/opt/zymtrace/profiler/libzymtracecudaprofiler.so" \
    ZYMTRACE_CUDAPROFILER__ENABLE_PC_SAMPLING="true" \
    python -u your_script.py
Helm
Recommended for production Kubernetes clusters with GPU nodes.
1. Install the profiler with GPU support
helm repo add zymtrace https://helm.zystem.io

helm install profiler zymtrace/profiler \
  --create-namespace \
  --namespace zymtrace \
  --set profiler.cudaProfiler.enabled=true \
  --set profiler.args[0]="--collection-agent=ZYMTRACE_URL" \
  --set profiler.args[1]="--enable-gpu-metrics" \
  --set profiler.args[2]="--nvml-auto-scan"
If TLS is not enabled, add --disable-tls:
--set profiler.args[3]="--disable-tls"
2. Configure your GPU workload
See a complete Kubernetes Job example.
Basic GPU profiling - add the following volume and environment variables to your pod spec:
volumes:
  - name: zymtrace-gpu-profiler
    hostPath:
      path: /var/lib/zymtrace/profiler
      type: Directory
containers:
  - name: your-container
    volumeMounts:
      - name: zymtrace-gpu-profiler
        mountPath: /opt/zymtrace/profiler
        readOnly: true
    env:
      - name: CUDA_INJECTION64_PATH
        value: "/opt/zymtrace/profiler/libzymtracecudaprofiler.so"
With PC sampling - add ZYMTRACE_CUDAPROFILER__ENABLE_PC_SAMPLING and set privileged: true on the container (see PC Sampling):
containers:
  - name: your-container
    securityContext:
      privileged: true
    env:
      - name: CUDA_INJECTION64_PATH
        value: "/opt/zymtrace/profiler/libzymtracecudaprofiler.so"
      - name: ZYMTRACE_CUDAPROFILER__ENABLE_PC_SAMPLING
        value: "true"
See a vLLM inference example.
Docker
For Docker-based workflows and development environments.
1. Start the profiler
docker run --cgroupns=host --pid=host --privileged --net=host \
-v /etc/machine-id:/etc/machine-id:ro \
-v /var/run/docker.sock:/var/run/docker.sock \
-v /sys/kernel/debug:/sys/kernel/debug:ro \
-v /var/lib/zymtrace/profiler:/opt/zymtrace-cuda-profiler \
--rm -d --name zymtrace-profiler ghcr.io/zystem-io/zymtrace-pub-profiler:26.4.4 \
--collection-agent ZYMTRACE_URL \
--enable-gpu-metrics \
--nvml-auto-scan
If TLS is not enabled, add --disable-tls before --collection-agent.
2. Run your application
Basic GPU profiling (no privileged access required):
docker run --gpus all \
  -v /var/lib/zymtrace/profiler:/opt/zymtrace/profiler:ro \
  -e CUDA_INJECTION64_PATH="/opt/zymtrace/profiler/libzymtracecudaprofiler.so" \
  --ipc=host \
  --rm -d \
  <YOUR_IMAGE>
With PC sampling (requires --privileged, see PC Sampling):
docker run --gpus all --privileged \
  -v /var/lib/zymtrace/profiler:/opt/zymtrace/profiler:ro \
  -e ZYMTRACE_CUDAPROFILER__PRINT_STATS="true" \
  -e ZYMTRACE_CUDAPROFILER__QUIET="false" \
  -e ZYMTRACE_CUDAPROFILER__ENABLE_PC_SAMPLING="true" \
  -e CUDA_INJECTION64_PATH="/opt/zymtrace/profiler/libzymtracecudaprofiler.so" \
  --ipc=host \
  --rm -d \
  <YOUR_IMAGE>
vLLM example
Running the openai/gpt-oss-20b model with vLLM:
docker rm -f vllm-server 2>/dev/null || true
docker run --gpus all --privileged \
  -v ~/.cache/huggingface:/root/.cache/huggingface \
  -v /var/lib/zymtrace/profiler:/opt/zymtrace/profiler:ro \
  -e CUDA_INJECTION64_PATH="/opt/zymtrace/profiler/libzymtracecudaprofiler.so" \
  -e RUST_LOG="zymtracecudaprofiler=info" \
  -e ZYMTRACE_CUDAPROFILER__PRINT_STATS="true" \
  -e ZYMTRACE_CUDAPROFILER__QUIET="false" \
  -e ZYMTRACE_CUDAPROFILER__ENABLE_PC_SAMPLING="true" \
  -e VLLM_ATTENTION_BACKEND="TRITON_ATTN_VLLM_V1" \
  -p 8000:8000 \
  --ipc=host \
  --rm -d \
  --name vllm-server \
  vllm/vllm-openai:latest \
  --model openai/gpt-oss-20b
PC Sampling (Optional)
PC sampling provides the deepest level of GPU performance insight, including stall reasons, SASS disassembly, and memory offsets. However, NVIDIA requires privileged access (sudo or --privileged) for PC sampling due to a security vulnerability (CVE-2024-0090). We recommend enabling PC sampling in development environments and on-demand in production when deeper analysis is needed.
See the commands labeled With PC sampling in each installation tab above.
Next steps
- Profiling GPU Workloads - full Kubernetes examples and advanced configuration
- Install zymtrace profiler - comprehensive installation options (Helm values, arm64, etc.)
- GPU Profiler Environment Variables - all available tuning knobs