K8s Resource IQ
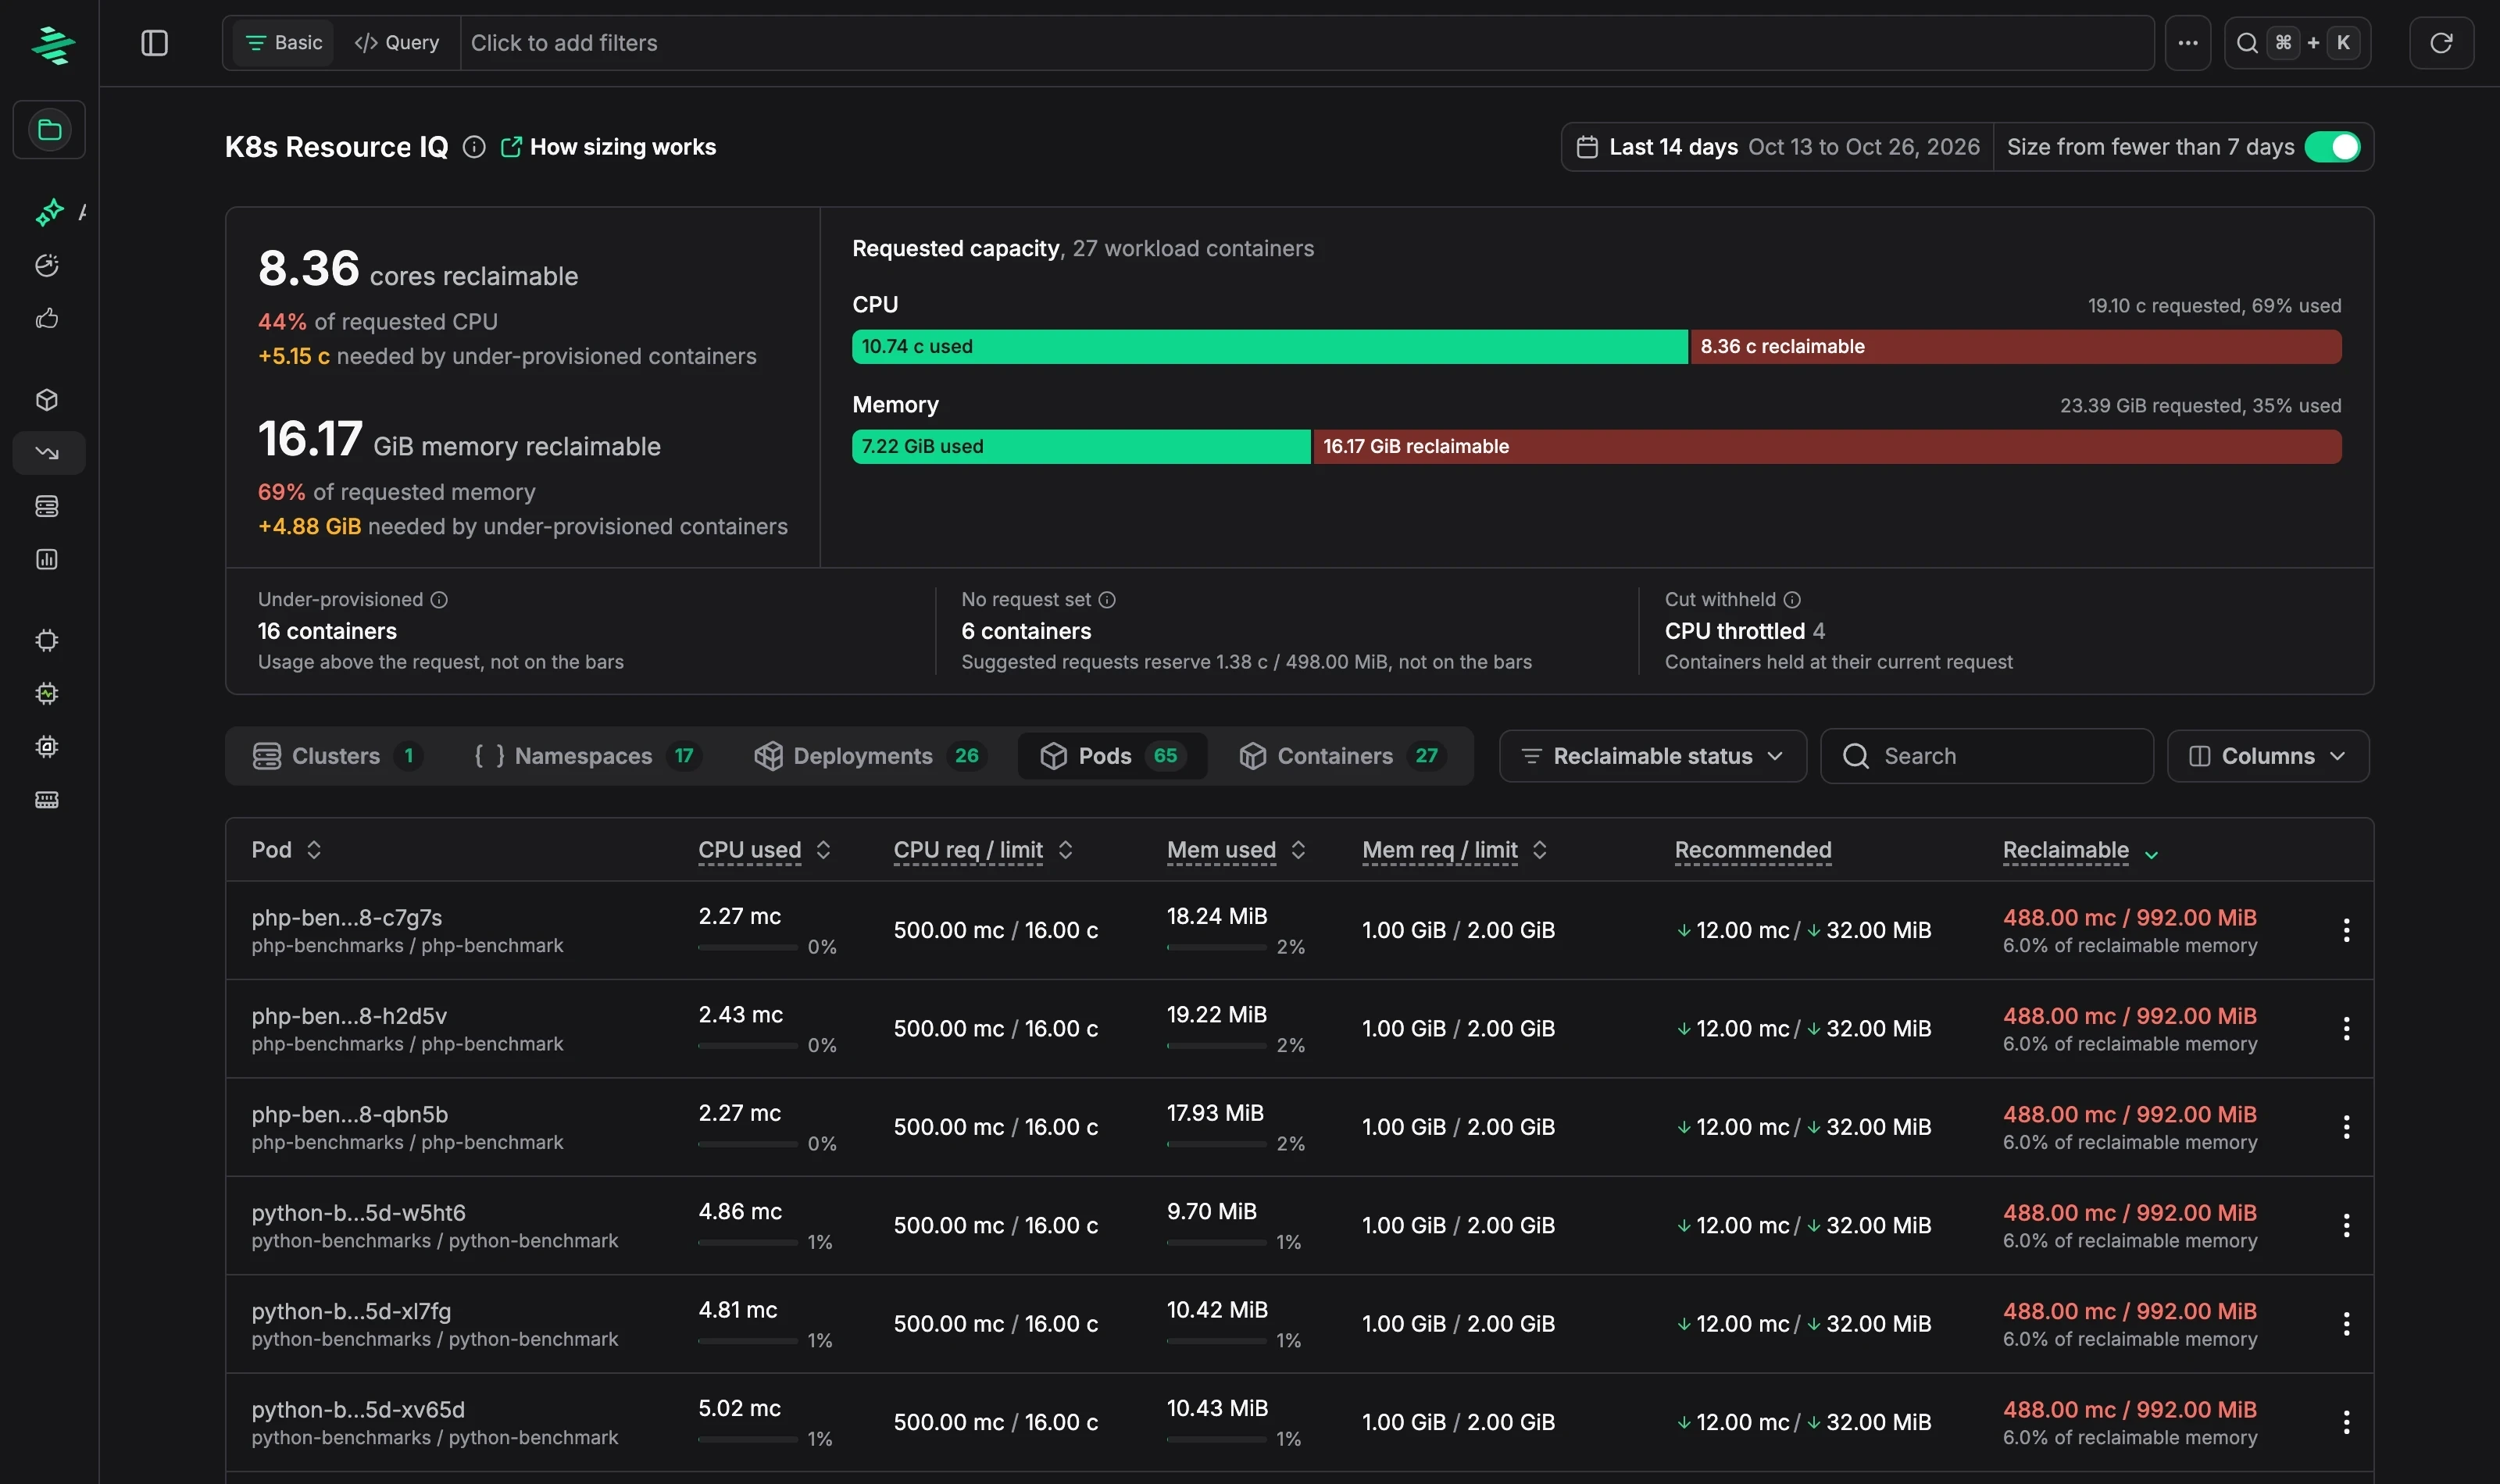
K8s Resource IQ compares the CPU and memory requests and limits of your Kubernetes containers with their observed usage. It shows how much requested capacity you can reclaim, which containers need more, and the values to apply. Zymtrace doesn't change your cluster; you decide what to apply.
Requirements
- The profiler runs as a DaemonSet with access to the Kubernetes API.
- Nodes use cgroup v2. Check with
stat -fc %T /sys/fs/cgroup; it must printcgroup2fs. -enable-host-metricsis on (the default).-cluster-nameis set to a different value per cluster. Without it, workloads with the same namespace, owner, and container name are merged across clusters and show Cluster name unset.
Summary
- Reclaimable CPU and memory: capacity requested but not needed, as a total and as a share of what's requested. Capacity needed by under-provisioned containers is shown separately.
- Requested capacity: for CPU and memory, how much of the total request is used and how much can be reclaimed.
- Under-provisioned: containers that use more than they request.
- No request set: containers without a request, and how much the suggested requests would reserve.
- Cut withheld: containers where a reduction looked possible but isn't suggested, for example because they're CPU throttled. They keep their current request.
Group the table by Clusters, Namespaces, Deployments, Pods, or Containers. Each container row shows current usage, requests and limits, the Recommended request, and how much it frees up or needs.
Applying a suggestion
Open a row's menu and choose View details to see:
- Recommendation: current and suggested request and limit for CPU and memory, and a
resourcesblock to paste into your container spec. Suggestions can raise values as well as lower them. For example, a CPU-throttled container gets a higher CPU limit. - CPU usage per pod and Daily memory peaks over the sizing window.
- Live pods seen in the last hour.
- Sizing inputs and Evidence behind the suggestion.
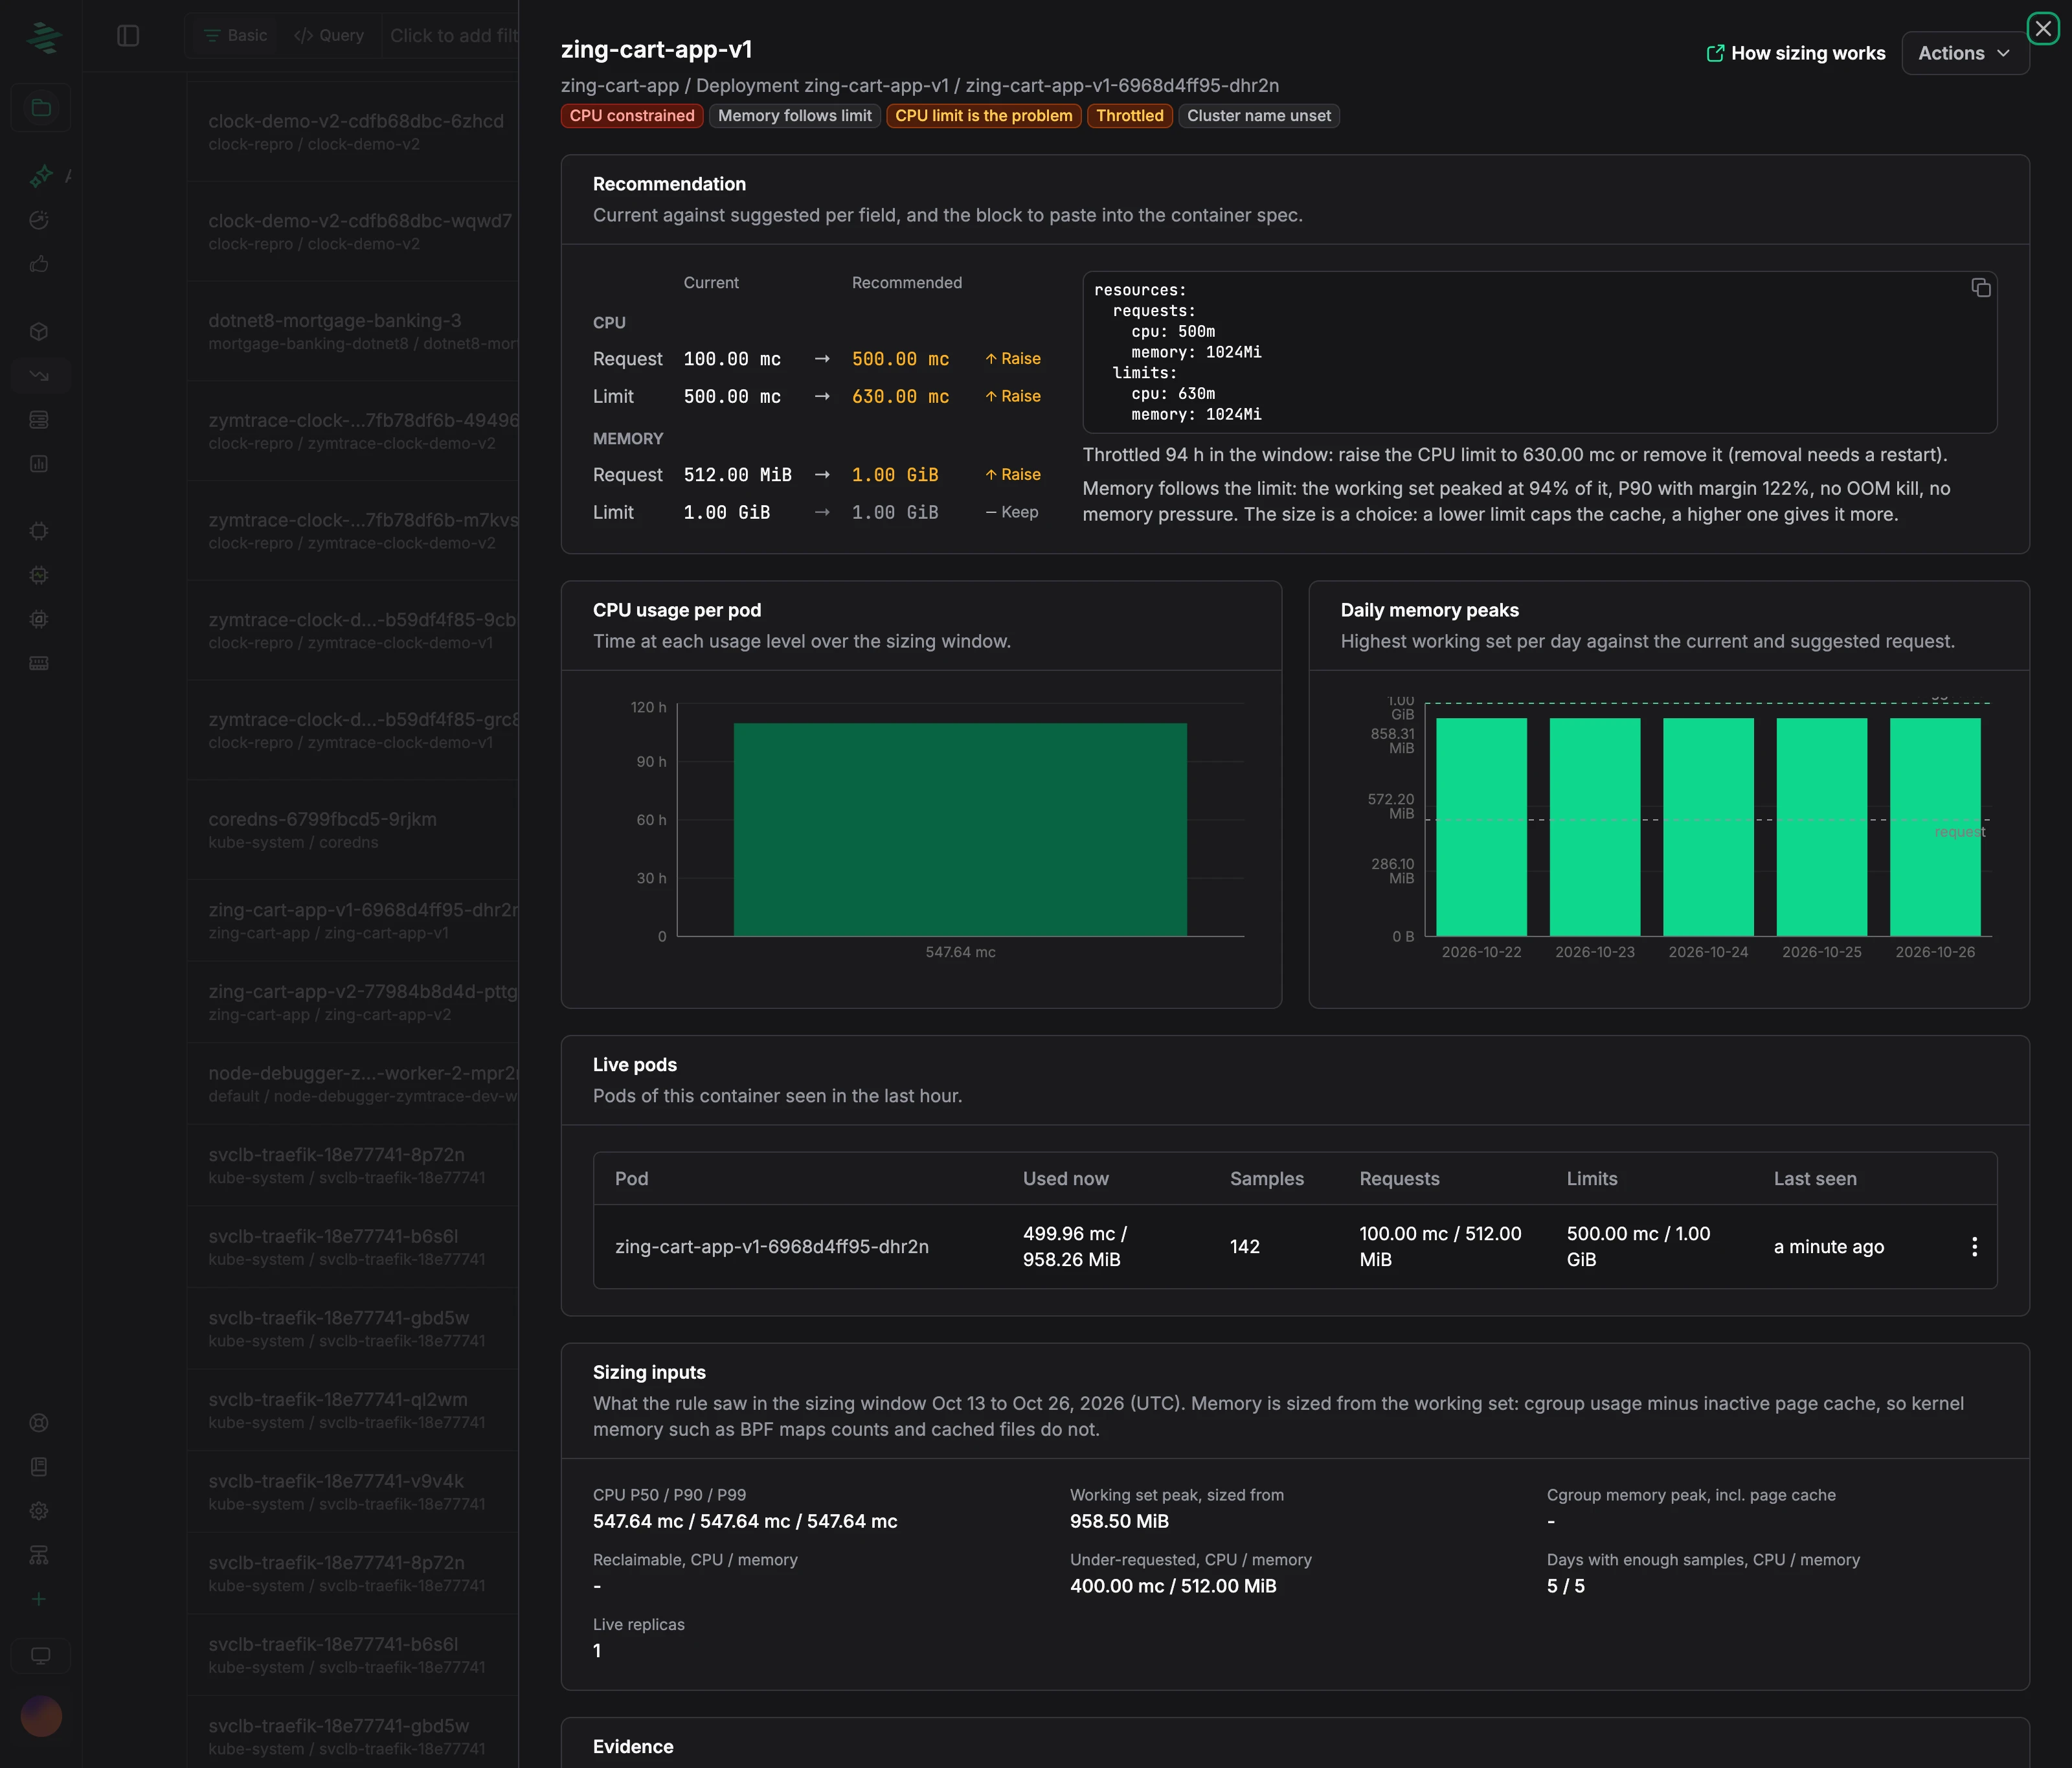
To copy the values directly, choose Copy resources YAML from the row menu. To see what's using the CPU, choose Analyze with CPU Flamegraph or View CPU Top Functions.
Before you apply a suggestion:
- Horizontal Pod Autoscalers scale on usage divided by request. Lowering the request can make the HPA add replicas, so adjust its target utilization too.
- Java, .NET, and similar runtimes size their heap from the memory limit. Set the heap size explicitly before you lower the limit.
- Removing a CPU limit needs a pod restart.
How sizing works
Suggestions are based on usage over the sizing window, the last 14 complete UTC days:
- CPU is sized from usage percentiles (P50, P90, and P99) across the window.
- Memory is sized from the working set: memory usage minus inactive page cache. Kernel memory counts; cached files don't.
- Safety checks, such as CPU pressure and daily memory peaks against the limit, can hold back a reduction.
All replicas of a workload share one pod template, so Zymtrace sizes each container of a workload once, for its busiest replica. Jobs, CronJobs, and init containers aren't sized.
| Field | Suggestion |
|---|---|
| CPU request | P90 + 15% |
| CPU limit | P99 + 15%. Never added, and never lowered after throttling. |
| Memory request and limit | Highest daily working set + 30%. The limit is raised only after an OOM kill, eviction, or memory pressure. A container without a memory limit gets one. |
Cuts of less than 10% aren't suggested.
When a cut is withheld
A container that's already short of a resource only shows what it got, not what it needed, so Zymtrace doesn't suggest a cut:
| Reason shown | Cause |
|---|---|
| CPU constrained | Heavy CPU throttling or CPU pressure |
| CPU throttled | Any throttling; blocks lowering the CPU limit only |
| Memory constrained | OOM kill, eviction, or memory pressure; the memory limit is raised instead |
| Memory follows the limit | The working set grows to fill the limit, typical for runtimes that size their heap from it. Set the heap size explicitly, then size the container from the heap. |
Getting suggestions sooner
A container is sized once it has at least 7 days with enough data. Turn on Size from fewer than 7 days to size containers with less history. This is useful in the first 14 days after you deploy Zymtrace, or for new workloads, before a full sizing window is available. Suggestions based on fewer days reflect less of your traffic pattern, so review them before you apply them.
Limitations
- Usage is averaged over the profiler's 30-second collection interval, so shorter bursts aren't visible. This is why CPU limits are never added.
- Patterns longer than 14 days, such as monthly batch jobs, aren't in the data.
- Workloads scaled to zero for more than an hour don't appear.