GPU Timeline
The timeline view plots what each GPU was doing, moment to moment, over a short window: the CUDA kernels launched on every stream and how much GPU memory each process held. Use it to line up a memory spike with the work running at that moment, or to see how work is distributed across streams and GPUs.
Unlike the GPU metrics dashboard, which trends utilization and memory over long ranges, the timeline is a high-resolution, per-kernel view meant for zooming into a few seconds of activity.
The timeline is in Beta. It is populated only while high-resolution profiling is enabled, which has high overhead — turn it on for short windows and scope it to the specific hosts or pods you are investigating. See Enabling high-resolution profiling below.
Enabling high-resolution profiling
High-resolution profiling is off by default. When enabled, it collects per-kernel-launch CUDA events with nanosecond precision instead of aggregating them, and samples GPU memory far more often than the default -collect-metrics-interval. The denser memory sampling increases the volume of memory series sent over the wire and stored.
Enable it from a rule under Settings → Agent Config:
- Open Settings → Agent Config and click + Add Rule.
- Scope the rule with a CEL expression to the process, container, or host you want to inspect.
- Turn on the High-Resolution Profiling setting.
- Set an expiry so profiling stops on its own. High-resolution rules require one.
Per-kernel collection is expensive. High-resolution profiling records every kernel launch instead of sampling them, so its cost scales with your launch rate. On a high-throughput workload it takes roughly 400mc of extra CPU for the profiled scope, on top of the baseline cost in the profiler resource guide. Enable it just long enough to capture the behavior you are chasing, on as narrow a scope as possible, then let the rule expire.
Opening the timeline
The timeline lives behind an overview chart showing high-resolution event density over your selected range. Brush a sub-window on that chart to load its detail. The profiler builds the timeline for that slice and renders it.
If the brushed window holds too many events, the view reports "Too many events to load" instead of rendering. Select a shorter interval, or narrow the query, and try again.
If a range shows "No high-resolution data in this range", high-resolution profiling was not active for those hosts during that time. Enable it (see above) and capture a fresh window.
Reading the timeline
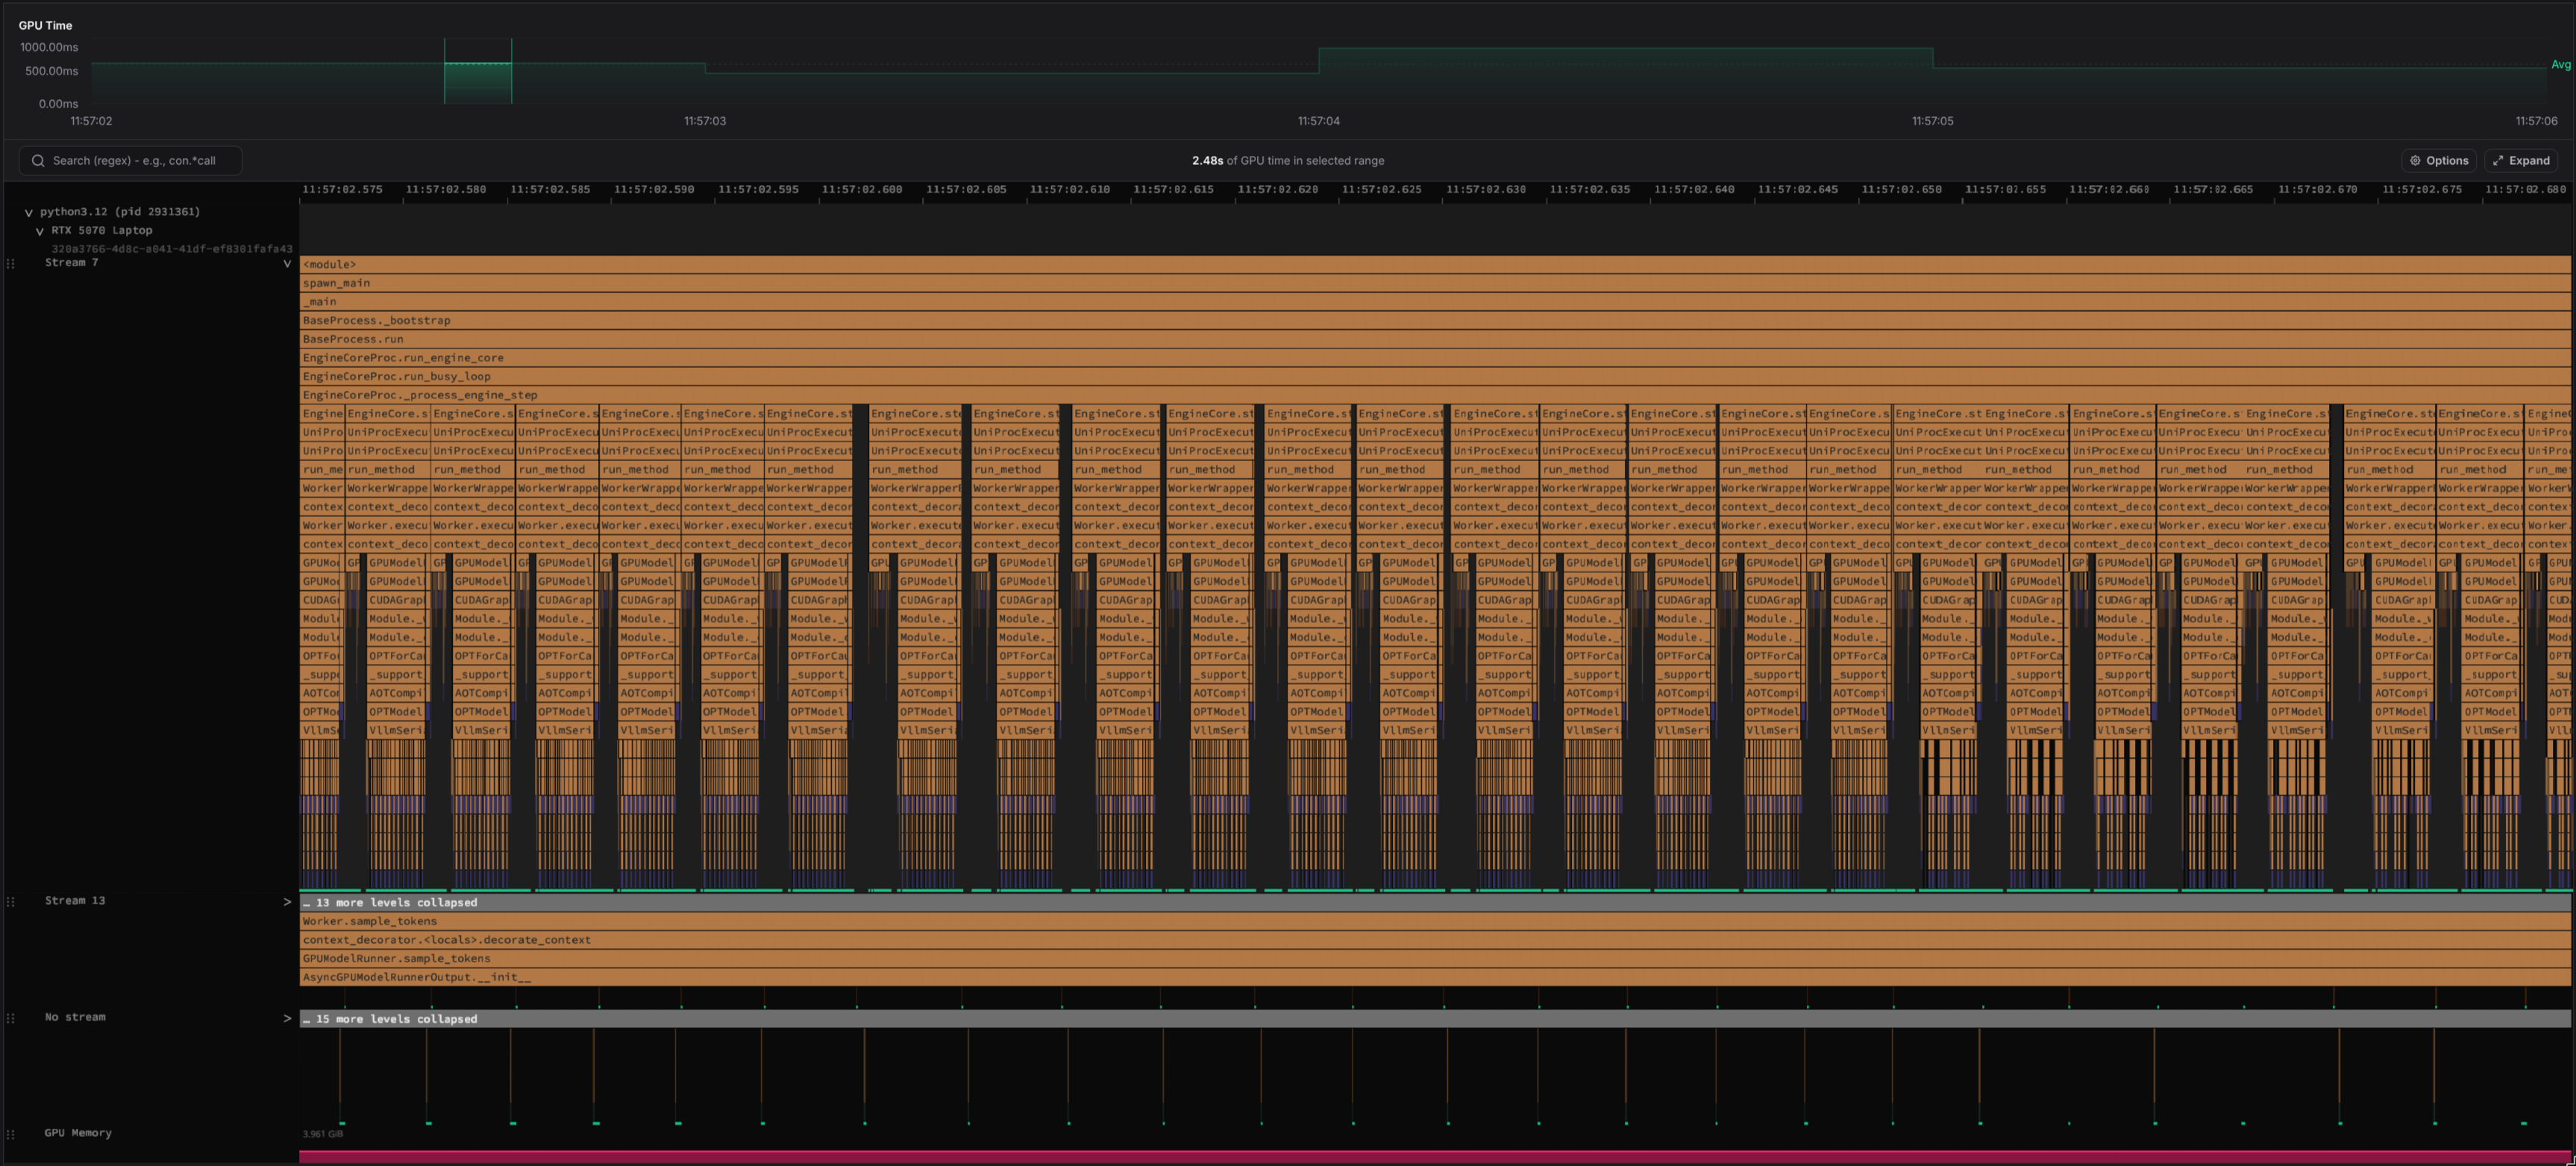
Tracks are grouped top-down by process, then by GPU, then by the streams on that GPU:
my-training-job (pid 4812)      ← process
  GPU 0                         ← GPU on that process
    Stream 7                    ← CUDA stream: kernel launches
    Stream 13
    GPU Memory                  ← memory the process held on that GPU
  GPU 1
    Stream 7
    GPU Memory
- Process groups every GPU a single process touched, labeled with the executable name and pid.
- GPU groups the lanes for one physical GPU (or MIG instance). Turn on Show GPU UUID to display the device UUID beneath the GPU name.
- Stream lanes show the CUDA kernel launches on that stream, laid out on the shared time axis. Pan and zoom to move through the window.
- GPU Memory lanes show how much memory the process held on that GPU over time.
The leaf indicator
A kernel launch can be far shorter than one pixel at the zoom level you are looking at. It still draws, but as a sliver that is easy to miss entirely.
Every stream lane carries a thin green strip along its bottom edge. The strip marks each horizontal position holding a leaf, meaning a frame with no frame drawn beneath it (i.e. CUDA operations). Marks are at least 2 pixels wide, so a leaf too narrow to spot in the rows above still registers in the strip. Adjacent marks merge, so a dense run of leaves reads as one continuous bar.
Read the strip as a map of where the innermost work actually sits, then zoom into a marked position to resolve the spans behind it.
What counts as a leaf and what doesn't, respects what is currently filtered out. Hiding frame kinds from the legend or typing in the search box turns shallower frames into leaves, and the strip follows.
A collapsed lane keeps its strip, and the strip still marks leaves that the lane's row budget dropped. A collapsed lane therefore keeps telling you where its innermost frames are, even when it does not display them.
A leaf whose start and end timestamps are equal still gets a mark. GPU memory lanes have no strip.
The GPU memory graph
Each GPU Memory lane draws the sampled memory series as a filled area under a line. Under high-resolution profiling the series is sampled many times per second, so short-lived allocation spikes are visible rather than averaged away. Hover any point to read its timestamp and byte value.
By default the lane's vertical scale spans the minimum and maximum of the whole captured series, so its height is comparable as you pan. Enable Scale GPU memory to current view to rescale the graph to only what is visible, which exaggerates small variations within the current window.
Timeline options
Open the Options popover (gear icon) above the timeline to change how the timeline is drawn. Reset restores every default below.
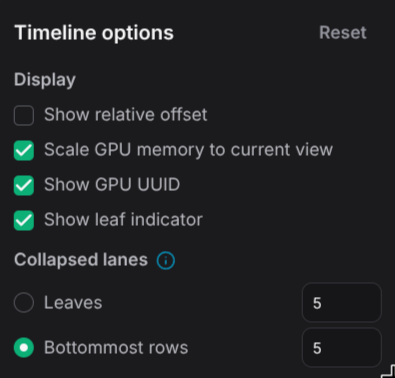
The popover above is showing a customized panel rather than the shipped defaults. Every default is stated below.
Display
| Option | Default | Effect |
|---|---|---|
| Show relative offset | On | Label the time axis as an offset from the start of the window. Turn it off to read absolute wall-clock timestamps instead. |
| Scale GPU memory to current view | On | Rescale every GPU memory graph to the min/max of the visible range, updating live as you pan and zoom. When off, the scale spans the whole captured series, which keeps lane heights comparable while you move around. |
| Show GPU UUID | On | Add a second header line under each GPU group carrying its device UUID. Useful when one host exposes several identical GPU models. |
| Show leaf indicator | On | Draw the leaf indicator strip along the bottom of every stream lane. Turn it off to give each lane back the 5 pixels of height the strip occupies. |
Collapsed lanes
A collapsed stream lane cannot show its whole stack, so these settings decide which part of it survives. One row is one level of the stack. The number beside each mode is how many rows that mode gets.
Bottommost rows
This is the default. It counts up from the deepest stack in the lane and keeps that many rows. Nesting stays intact, so a frame three levels above the lane's deepest leaf still sits three rows above it. A stack that ends above the cut is not drawn at all, so a shallow call path can vanish while a deeper one beside it stays.
Reach for it when you want the collapsed lane to read as the bottom slice of the expanded lane, with depth still meaningful across the whole lane.
Leaves
This places every frame by its distance to the deepest leaf beneath it. Each stack's innermost frame lands on the bottom row and its callers stack upward from there. A frame drops out once its distance to the deepest leaf in its own subtree reaches the row count.
Reach for it when stack depth varies a lot across the window, because every span keeps its innermost frame no matter how shallow its stack is.
The two modes side by side
Take a lane holding two stacks, A → B → C and D → E, with both modes set to 2 rows.
A never survives in either mode. The two modes differ on the shallow stack:
- Bottommost rows cuts at one fixed depth for the whole lane, so
Dis gone andEkeeps its absolute depth, leaving the bottom row of that stack empty. - Leaves anchors each stack's innermost frame to the bottom row, so
D → Esurvives whole.
Row count
Both modes default to 5 rows, and each mode remembers its own number, so switching modes does not overwrite the other value.
The number must be at least 1 and at most the depth of the deepest stack currently loaded. A value outside that range is rejected with an error on the input and the lane keeps its previous setting.
That upper bound is not fixed for the session. It tracks the deepest lane in the whole timeline, so it grows while chunks stream in. Hiding frame kinds from the legend or typing in the search box re-packs the rows, which lowers the depth and pulls the cap down with it.
Reordering lanes
Stream and GPU memory lanes carry a drag grip (the dotted handle on the left of each lane's label). Drag a lane up or down to reorder it within its GPU group — for example, to place the GPU Memory lane directly beside the stream you are comparing it against. Neighboring lanes shift aside as the dragged lane's edge passes them, and drop into place when you release.
Lanes can only be reordered among their siblings under the same GPU; you cannot move a lane into a different process or GPU.
Collapsing lanes and groups
- Click a process or GPU header to collapse its subtree and hide everything beneath it.
- Click a stream lane's caret (on the right) to collapse it. The lane keeps the number of rows set under Collapsed lanes, with function names still readable, so it costs much less vertical space while staying legible.
- When a collapsed lane is deeper than its row budget, a … N more levels collapsed banner sits on top of its rows. Click the banner to expand that lane back to its full depth.